 LeoStatistic 17.4
Universal tool for statistical analysis and modeling of experimental and market data. Support import data from variety of data sources. Statistical schemes cover all major data modeling operations. Create report ready output.
Last update
7 Aug. 2009
Licence
Free to try |
$52.45
OS Support
Windows
Downloads
Total: 1,824 | Last week: 2
Ranking
#232 in
Mathematics
Publisher
Leokrut
Screenshots of LeoStatistic
LeoStatistic Publisher's Description
Comprehensive tool for statistical analysis and modeling of experimental and market data.
Universal input from outside data sources: from text or database files; file type and edit in spreadsheet like control; copy/paste from spreadsheets applications like MS Excel or Access; extract curve in numerical form from image chart; image file.
Data manipulation procedures permit to new create and modify existing variables using simple formulas or schemes. Syntax of formulas incorporates itself ability to use indexing variables that permit to create differential variables.
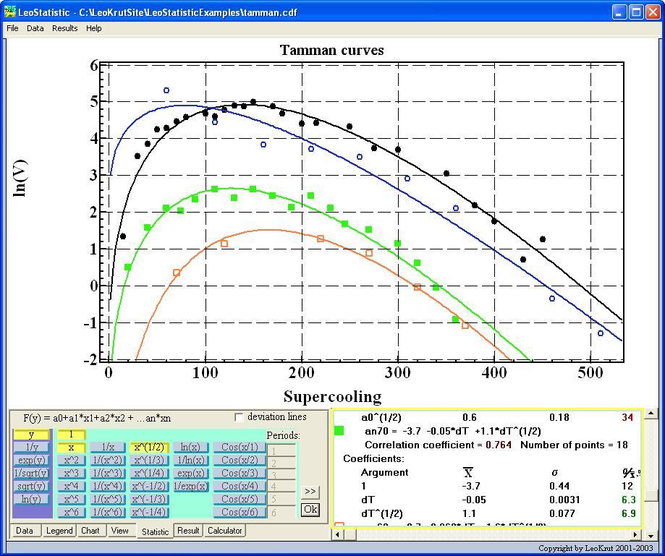
Statistical schemes of the program incorporate: distribution of one variable with comparison T, Erlang and Poisson probability; conditional distribution depend on values of other parameters; two arguments distribution with 3D presentation or color map presentation; curve fitting with variety schemes to define modeling formula; peaks revealing with base line elimination and special emphasizing on mass chromatogram; 3D presentation of function of two arguments and with plane, parabolic and user formula multivariate approximation; near neighbors method for multivariate estimation; creating score variable that reflect probability for given variable be large then chosen number and algorithm for calculation of the score from other significant parameters.
Found approximated coefficients are accompanied with their calculated standard deviations. The accuracy of presentation of their numerical values can be set by user or automatically defined on the base of stability of their computation. Automatically run a comprehensive statistical analysis by one mouse click.
Convenient user interface permits to design professional looking visualization of the data and modeling formulas. Color, size and shape of point marks and formula lines as well elements of graphic including font of the description could be easy modified. A report of present statistical analysis can be saved in form of MS Word document or HTML page.
What's New in Version 17.4 of LeoStatistic
33%
Look for Similar Items by Category
Feedback
- If you need help or have a question, contact us
- Would you like to update this product info?
- Is there any feedback you would like to provide? Click here
Popular Downloads
-
 Macromedia Flash 8
8.0
-
 Kundli
4.5
-
 My Talking Tom
1.0
- FastSum 1.9
-
 FastSum Standard Edition
1.6
-
 Cool Edit Pro
2.1.3097.0
-
 Cheat Engine
6.8.1
-
 Hill Climb Racing
1.0
-
 Windows XP Service Pack 3
Build...
-
 C-Free
5.0
-
 Horizon
2.9.0.0
-
 Tom VPN
2.2.8
- HP LaserJet 1100 Printer Drivers 4.3.2.5
-
 Mozilla Firefox
108.0...
- HP WLAN 802.11a/b/g W500 2.4.1.30
-
 Iggle Pop
1.0
- HP Deskjet 5400 Series (DOT4) 9.0.0.0
- HP LaserJet 4200 PS 60.3.14.2
-
 Vector on PC
1.0
-
 FormatFactory
4.3


